Creating Custom Model Images with Claude Code — No Coding Experience Required
If you’ve spent any time in an operational meteorology setting, you’ve probably had a moment where you wished you could pull a specific model field, display it exactly the way you want it — maybe a specific domain, a specific level, a specific variable — without waiting for someone else to build it.
One of many reasons why I learned to write python and javascript a little more than 10 years ago was to achieve this. Now, I think that’s changing. A meteorologist without a programming background can start doing this and I think it will become even easier in the coming months and years.
Over the past several months I’ve been experimenting with Claude Code, Anthropic’s AI coding assistant that runs directly in the terminal. The short version is this: you describe what you want in plain English, and Claude Code writes and runs the code to make it happen. You don’t necessarily need to understand Python to use it (but it’s still useful!). You need to understand meteorology — which you probably already do if you’re reading this.
I want to walk you through a example of what this looks like in practice.
What we’re building
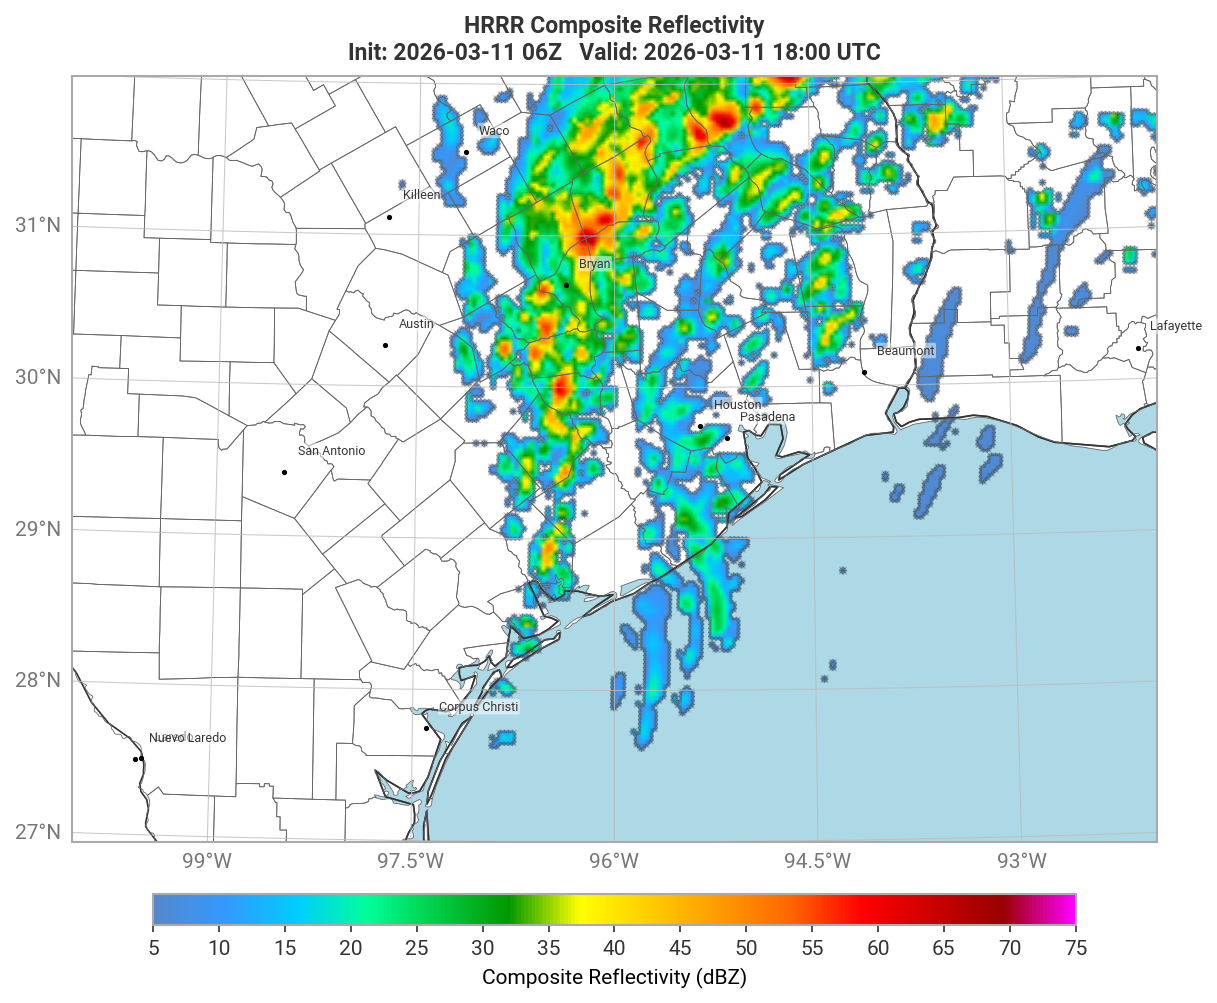
Let’s say you want to look at HRRR composite reflectivity over the southern plains — maybe you’re tracking convective initiation and you want a sequence of images stepping through several forecast hours. Here’s roughly what you’d type to Claude Code:
“Fetch HRRR composite reflectivity from AWS for the 06Z March 11, 2026 run. Make a sequence of images from forecast hours 12 through 19 covering the southern plains. Save each one as a PNG.”
That’s it. Claude Code asks a few clarifying questions if needed, figures out how to access the data (in this case from NOAA’s public S3 bucket), writes the Python to fetch and plot it, runs it, and saves the outputs. Here’s one of the resulting images:
And stepping forward a few hours:
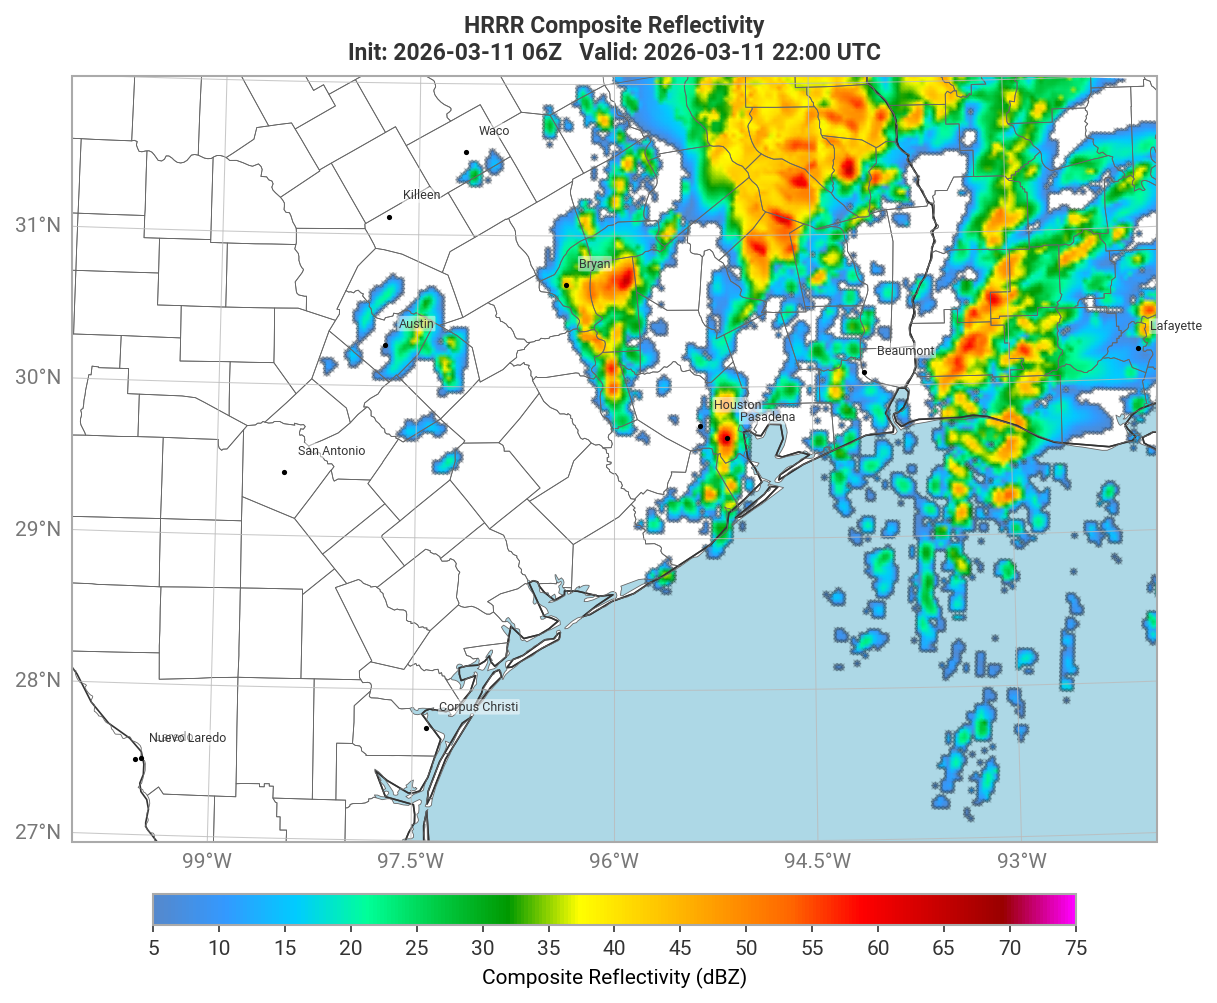
The styling — color tables, coastlines, state borders, gridlines — was handled automatically. I didn’t write a single line of code to produce these.
How it actually works
Claude Code is an AI assistant that has access to your file system and can run code on your behalf. You install it once, open it in your terminal, and then have a conversation with it. Think of it less like a search engine and more like a knowledgeable colleague sitting next to you — one who happens to be fluent in Python, knows where the model data lives, and can debug their own work when something goes wrong.
Under the hood, it used earthkit, a Python toolkit developed by ECMWF for accessing and visualizing meteorological data. Earthkit knows how to talk to ECMWF’s open data feeds, NOAA’s S3 buckets, the Copernicus Climate Data Store (for ERA5), and more. Claude Code knows how to use earthkit. The combination means you can get from a plain-English description to a publication-ready image without touching the code directly.
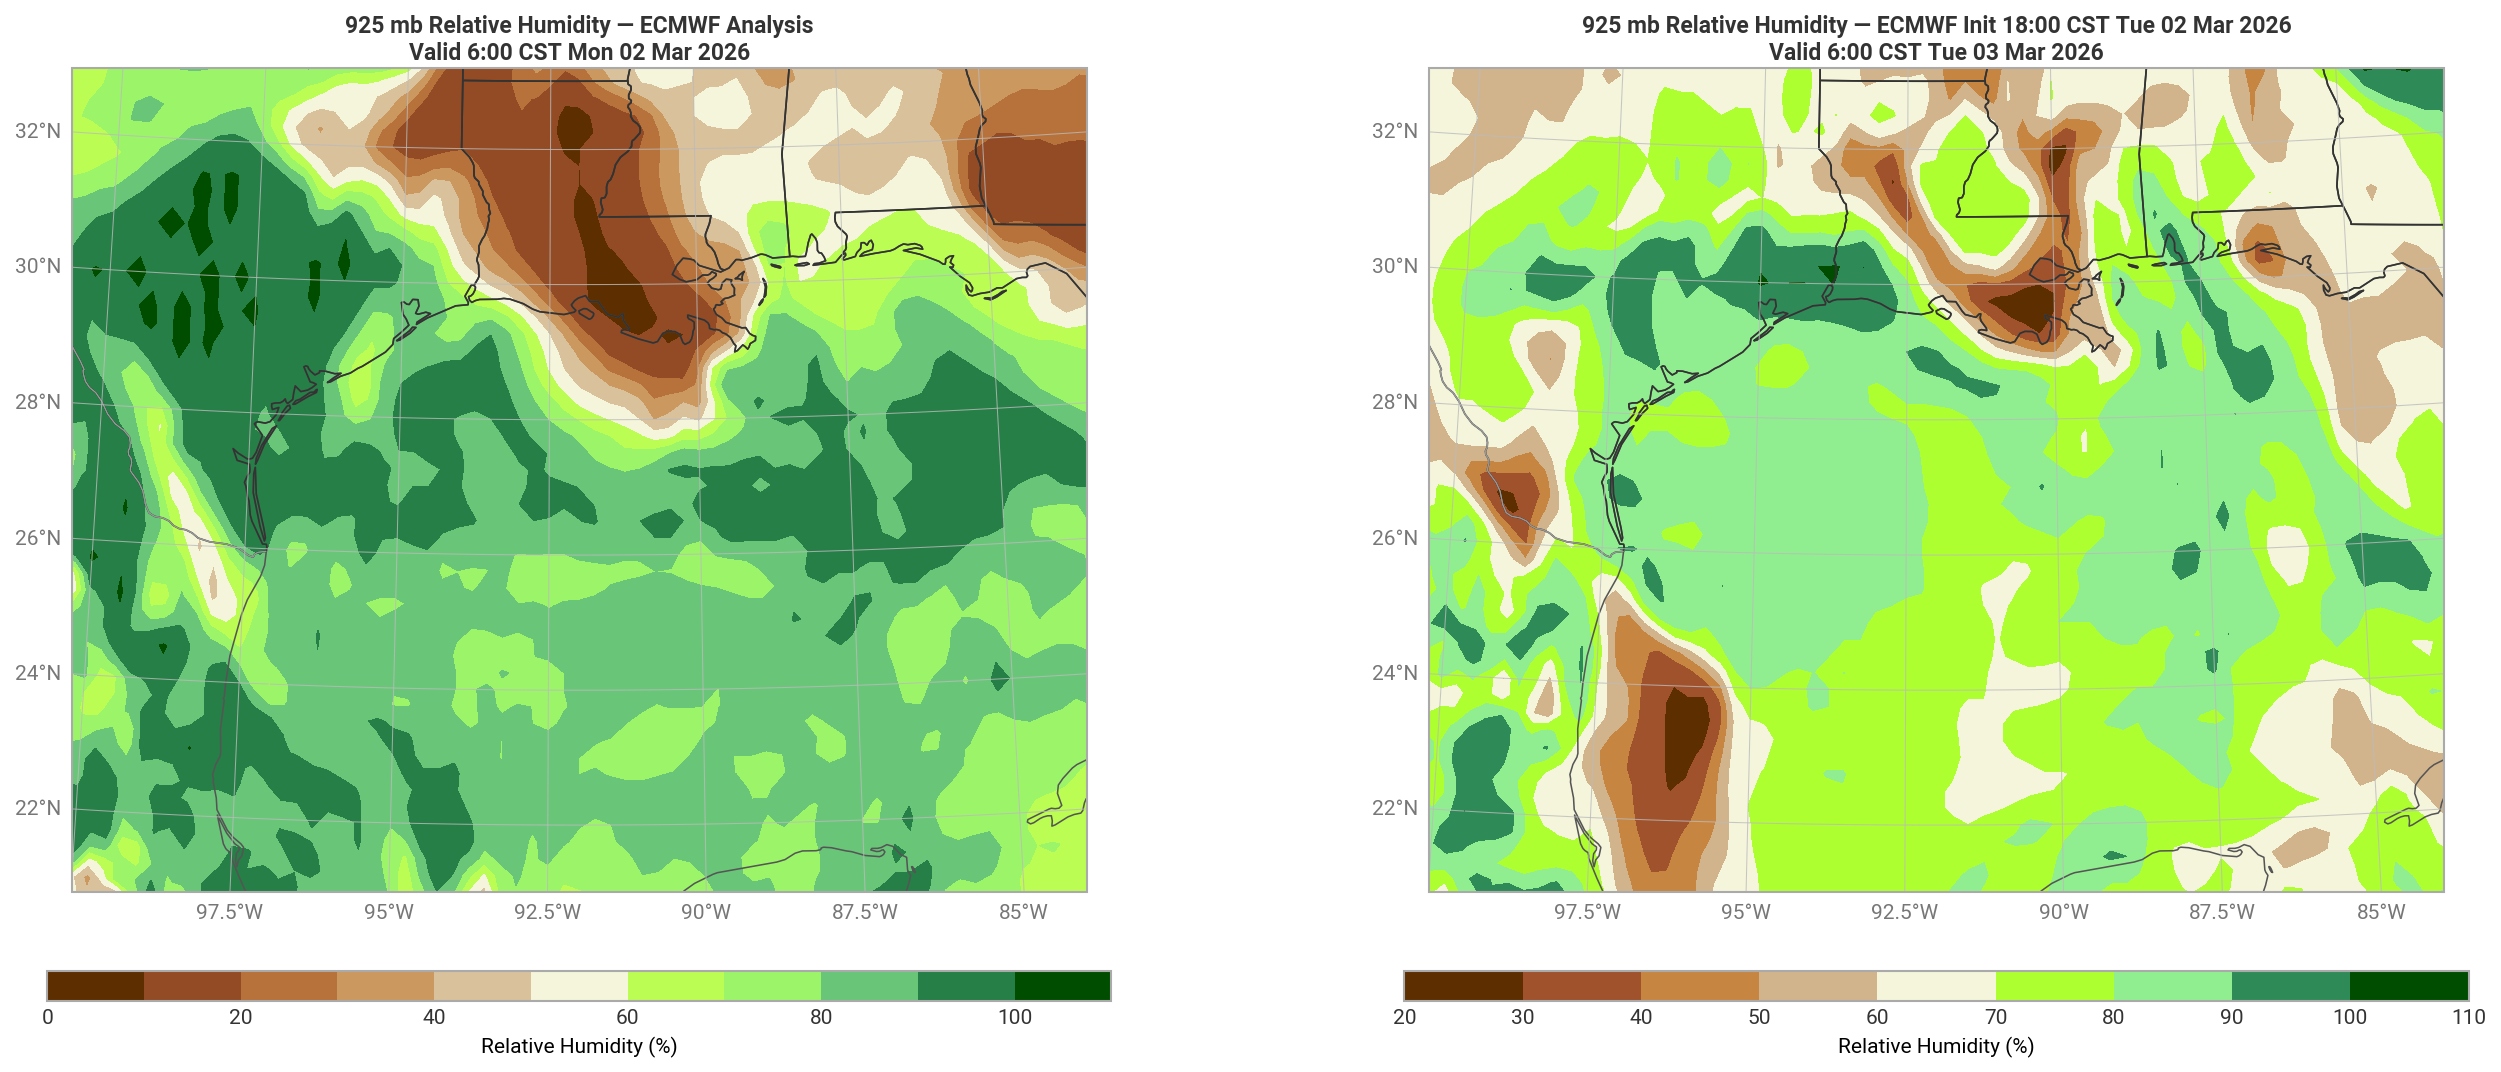
Here’s another example — 925 mb relative humidity from ECMWF analysis, useful for tracking low-level moisture transport:
Getting started
Here’s a minimal path to get up and running:
1. Install Claude Code
Claude Code requires a terminal and a Claude account. Download it from claude.ai/download and follow the setup instructions. If you’re on a Mac, the Terminal app (already on your machine) is all you need.
2. Set up a Python environment
You don’t need to know Python deeply, but you do need it installed. The cleanest way to manage this is with a tool called uv, which Claude Code can help you install. Once uv is set up, Claude Code can create a project environment and install earthkit for you — just ask it to.
3. Start asking
Open Claude Code in your terminal and describe what you want. Be specific about:
- The model (GFS, HRRR, ECMWF, ERA5)
- The variable (
composite reflectivity,2-meter temperature,925 mb relative humidity,mean sea level pressure) - The domain or region (
the southeast US,the Gulf of Mexico,lat/lon box) - The run time and forecast hour(s)
- What you want to do with the output (
save as PNG,show a sequence)
If something doesn’t look right, just tell it. “The color table doesn’t match what I’d expect for reflectivity — try a standard radar scale.” It will adjust and re-run.
A few honest caveats
I want to be straightforward about something: this workflow is more accessible than traditional coding, but it is not frictionless — especially at the start.
Getting your environment set up takes real time. Installing Claude Code, configuring a Python environment, installing earthkit and its dependencies, and understanding how to point Claude Code at the right data sources all involve steps that can feel foreign if you haven’t done them before. You will likely hit errors in the setup phase. Claude Code can help you work through them, but you should go in expecting that the first session might be mostly setup rather than producing images.
Learning to ask the right questions is also a skill that develops over time. Vague requests produce vague results. Early on you’ll find yourself re-prompting several times to get an image that looks the way you want it. That iteration gets faster as you learn what details matter — the run time, the forecast hour, the exact variable name, the domain bounds. Meteorologists tend to pick this up quickly because they already think precisely about these things; it’s just a matter of translating that precision into how you phrase the request.
None of this should discourage you. The ceiling is genuinely high, and once the environment is in place the day-to-day workflow is fast. But it’s worth setting realistic expectations: plan for a few hours of setup and experimentation before things feel natural.
Beyond the ramp-up, you’ll also occasionally hit situations where data isn’t available for the time you requested (model data on public servers has retention limits), or where output needs a few rounds of feedback to look exactly right. That’s normal. The more specific you are, the fewer corrections are needed.
You don’t need to understand the code that Claude Code writes — but reading it occasionally is worth doing. Over time you’ll start recognizing patterns, and that’s the beginning of actually learning to code if you want to go further.
Why this matters
The barrier to custom model visualization has historically been a Python script someone wrote years ago that you might be afraid to touch, or a web platform with a fixed set of variables and domains. Neither of those is ideal when you need to look at something specific.
The ability to ask for exactly what you need and have it rendered changes that dynamic. Meteorologists understand the data better than almost anyone — the question has always been whether they have the tools to explore it freely. I think the answer is increasingly yes.
If you give this a try and run into questions, feel free to reach out. I’m happy to share the setup I’m using.