Weather Programmer / polar vortex
Polar Vortex Diagnostics
Standardized geopotential-height anomaly over the polar cap (65–90°N), from the surface to 10 mb. Red is a high polar cap (weak vortex). The bars are the share of ECMWF extended-range members with 100 mb height at least +1σ — the lower-stratosphere descent test.
Loading latest init…
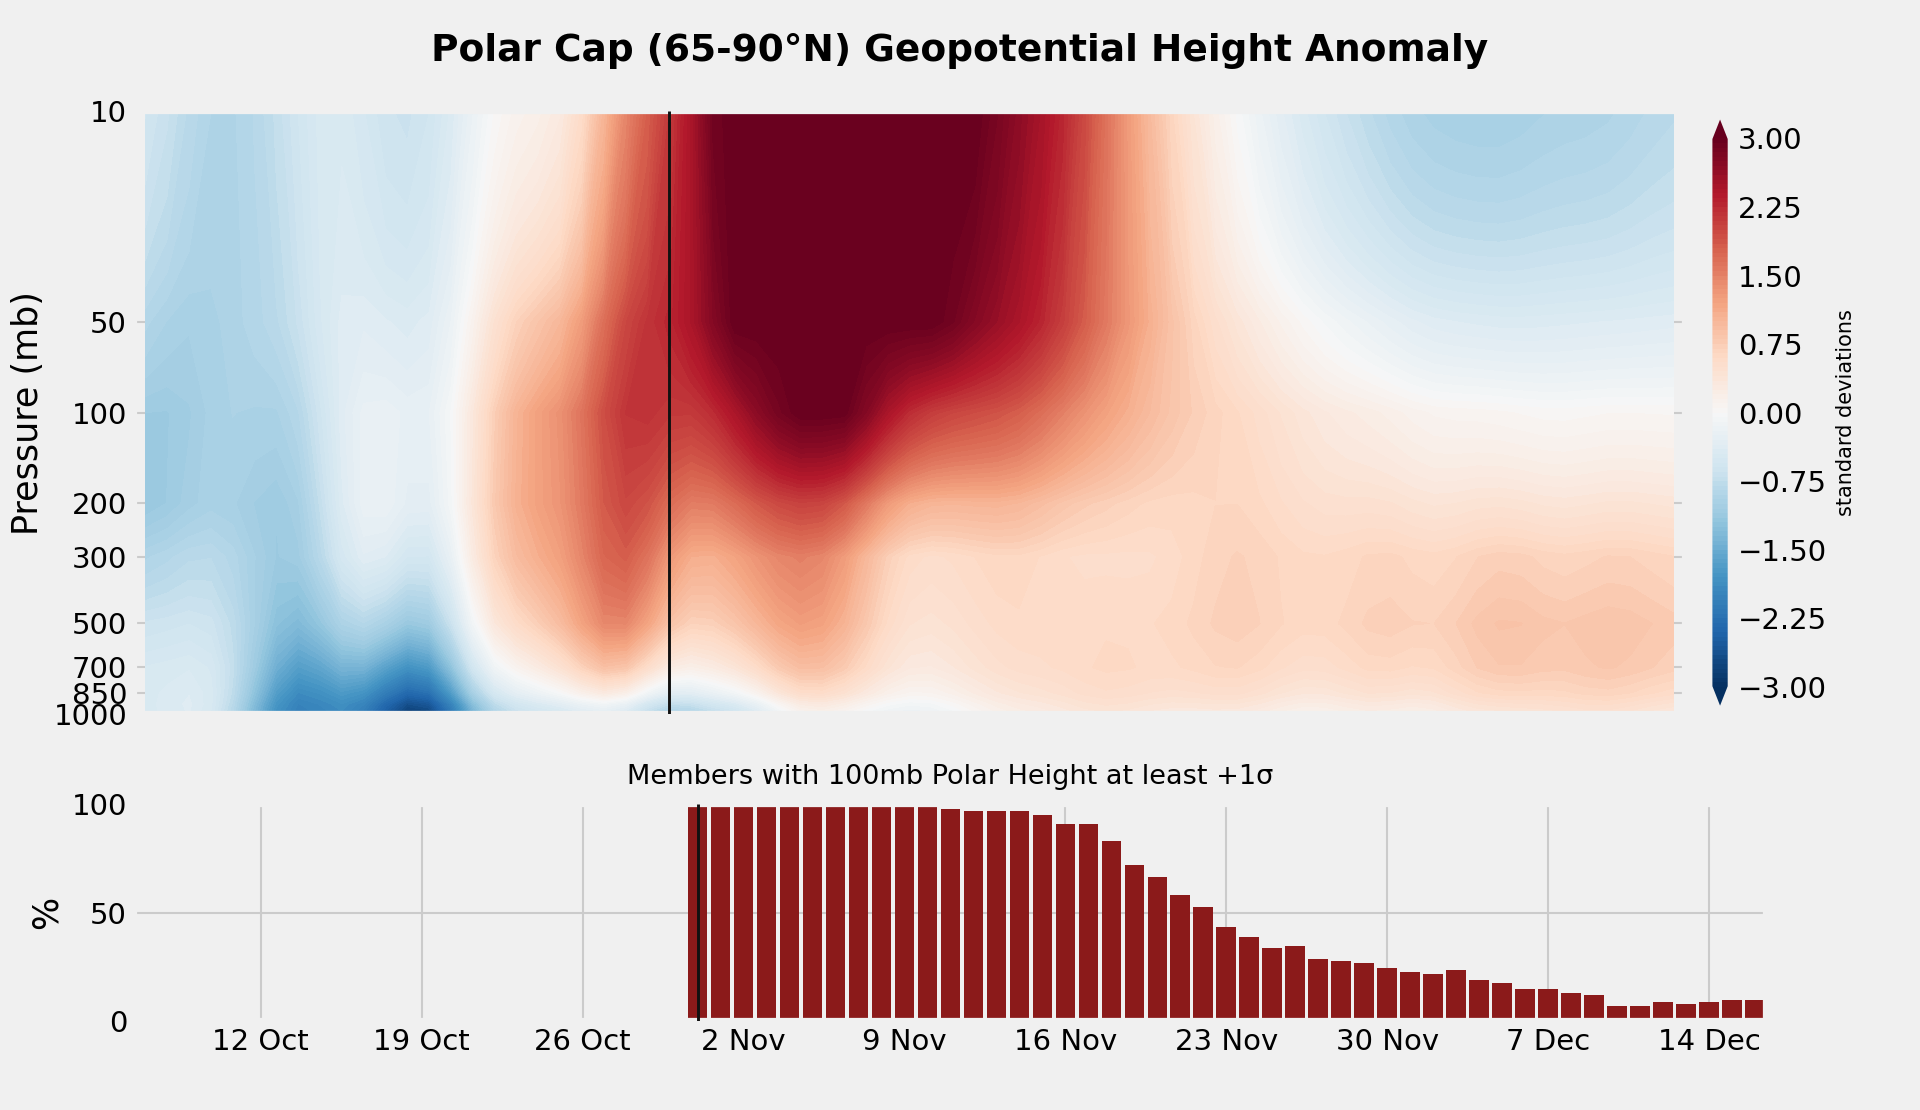
Left of the vertical line is ERA5 analysis. Right is the ECMWF extended-range ensemble mean (101 members), drift-corrected with ~100 S2S control reforecasts. Climate is NCEP/NCAR Reanalysis 1, 1991–2020.
How to read this chart
A sudden stratospheric warming shows up here as a deep red column in the upper stratosphere. Whether it matters for surface weather depends on whether that anomaly descends. The usual test is a lower-stratosphere polar-cap height of at least +1 standard deviation. This ensemble does not archive 150 mb, so the test uses 100 mb.
The top panel is the ensemble-mean standardized anomaly. The bottom panel is the member-by-member probability of clearing that +1σ threshold at 100 mb. High bars with little red below ~300 mb mean the ensemble still has a high polar cap aloft that has not yet coupled strongly into the troposphere.
Drift correction subtracts the model’s average lead-dependent bias, measured from about 100 S2S control reforecasts (5 nearby model dates × 20 hindcast years). Without it, the 500 mb polar cap can run about half a standard deviation high by week 3 — as large as a typical coupling threshold.
ERA5 lags the open-data weeklies by a day or two. The forecast starts at the initialization; analysis stops the day before. Diagnostics are experimental.